


CARB Pollution Mapping Tool
Sources in Your Community
Last updated November 16, 2022
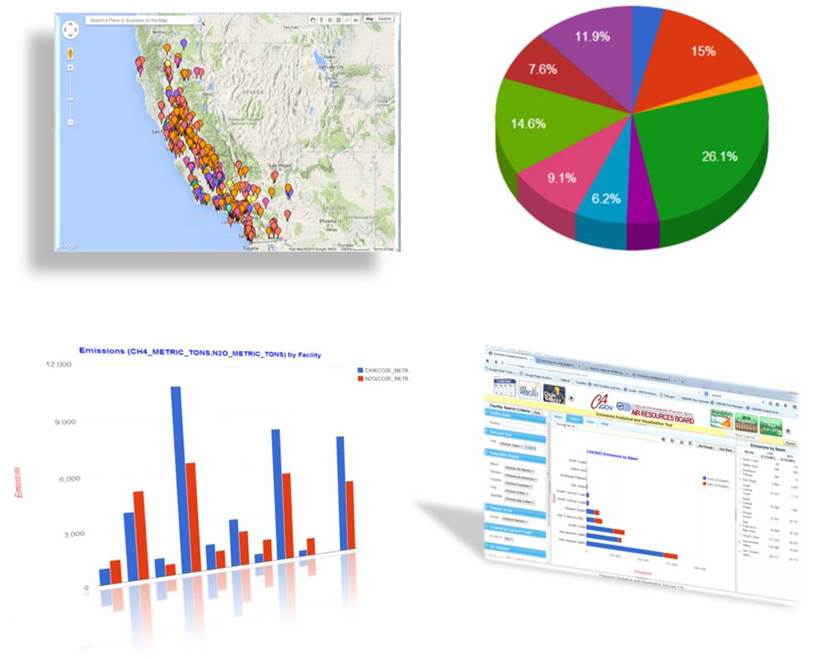
CARB has released an updated version of the CARB Pollution Mapping Tool (v2.6) that includes 2020 emissions data for criteria air pollutants, toxic air contaminants and greenhouse gases from large facilities in California. Users can select facilities by a number of attributes such as name, location, or industrial sector; view their reported emissions using maps, charts and tabular formats; and download data for later use.
A pre-release version of the CARB Pollution Mapping Tool (v3.0 beta) is also available for beta testing. This version incorporated data and analytical functions that focus on the mobile emissions from on-road vehicles such as cars, trucks and buses. Using the built-in Spatial Calculators, users can estimate emissions, view emission trends, and compare the relative contributions of various pollutants from both stationary and mobile sources in any areas of the state. A brief Help Guide is available to help you get started. Please email us your feedback to CARB Pollution Mapping Tool Team. We appreciate your help!
What's New
The CARB Pollution Mapping Tool (v2.6) includes the following updates:
- The 2020 emissions data for criteria, toxic and GHG pollutants are now available;
- Improved filter for Cap-and-Trade Covered Emissions;
- Included the CalEnviroScreen4.0 Tool under the 'Map Layers' tab;
- Updated SB 535 Disadvantaged Communities' boundaries based on CalEnviroScreen4.0;
- Added a check mark (✓) after the map layer if it is currently loaded on the map.
Other changes in the prior version of the tool include:
- Updated links to CARB's environmental justice and community air protection programs at the top of the window;
- Updated list of industrial facilities that are subject to AB 617 BACT/BARCT/TBACT requirements;
- Ability to search facilities and summarize emissions by census tract;
- New filter to allow sorting and displaying facilities based on their North American Industry Classification System (NAICS) code;
- Automatic loading of map layers when a geographic region is selected by the user;
- Updated air district names reflecting recent changes; and
- Clearer, simpler labels for GHG pollutants.
Caveats about Using Data in the Tool for Comparative Analyses
The criteria, toxic and GHG pollutant emissions data presented in the tool are collected through different emissions reporting programs, each designed to meet specific goals. Therefore, users of the Pollution Mapping Tool must be aware of the differences in reporting requirements and other limitations of the available data.
Read more...Things to know about Oil and Gas Facilities
In most cases, facilities reporting GHG and criteria pollutant emissions have a one-to-one relationship between the two programs (i.e., a facility that reports GHGs under MRR corresponds exactly to the same facility that reports criteria pollutants into CARB's CEIDARS database). However, this is not the case for onshore oil and natural gas production (oil and gas) facilities, because the definition of what constitutes a facility differs between the two programs.
In CEIDARS, an oil and gas facility is defined as a discrete, contiguous operation often described by a lease name or a collection of Township/Range/Sections that can be tracked down to the square mile. On the other hand, under MRR, an onshore oil and gas facility is defined as all of a company's aggregated operations within a geologic basin, which may encompass multiple counties and operations. Because of this difference, most onshore oil and gas production facilities do not have a one-to-one relationship between CEIDARS and MRR data. CARB has developed a preliminary crosswalk to identify and associate CEIDARS oil and gas facilities to their respective MRR facilities.
Read more...Differences between GHG and Criteria Pollutant Reporting Programs
| Criteria Pollutants | Toxic Pollutants | GHG Emissions | |
|---|---|---|---|
| Reporting Requirements | Emissions data are collected under various State and federal mandates that include the California Health and Safety Code, the California Clean Air Act of 1988, the Federal Clean Air Act Amendments of 1990, and the AERR | Emissions data are collected under the Air Toxics “Hot Spots” Act (AB2588, 1987, Connelly) | Emissions data are collected under CARB's Regulation for the Mandatory Reporting of Greenhouse Gases (MRR) |
| Reporting Mechanism | Emissions data are reported to CARB by the local air districts. In some cases, these emission estimates may be based on methodologies prescribed by the district and may differ from the emissions estimated by the facility. In addition, estimation methods may vary from district to district | Emissions data are reported to CARB by the local air districts. In some cases, these emission estimates may be based on methodologies prescribed by the district and may differ from the emissions estimated by the facility. In addition, estimation methods may vary from district to district | Facilities report their GHG emissions to CARB using CARB-designated quantification methods |
| Reporting Thresholds and Frequency | AERR requires facilities emitting 250 tons per year to report emissions annually and smaller facilities to report triennially; however, CARB guidelines set a much lower annual threshold (10 tons per year); furthermore, local air districts have the flexibility to set their own reporting thresholds | Only facilities meeting specific criteria are required to report. In general, inventories are required every four years, but air districts may require more frequent updates. Facilities that do not pose significant risk to public health may be exempted from update requirements. | Facilities emitting 10,000 metric tons or more of CO2equivalent emissions must report annually; facilities emitting 25,000 metric tons or more of CO2equivalent must have their emissions reviewed by an CARB-accredited verifier. |
| Storage Database | Criteria pollutant emissions data are stored in the California Emissions Inventory Development and Reporting System (CEIDARS), which serves as the main repository for emissions data used to develop air quality management plans to show attainment and maintenance of ambient air quality standards | Toxic pollutant emissions data are stored in the California Emissions Inventory Development and Reporting System (CEIDARS). Facility ID numbers are different from MRR database | Data are stored in CARB’s Mandatory Reporting Regulation (MRR) database. Facility ID numbers are different from CEIDARS database IDs |
| Oil and Gas Production Facilities | Oil and Gas Production emissions are reported at the sub-facility level, which can be a point-source facility or a collection of smaller sources within a contiguous oil or natural gas lease. In order to present GHG and criteria pollutant emissions that can be appropriately compared, the sub-facility criteria pollutant emissions were aggregated to match the MRR facility definitions | Oil & Gas Production emissions are reported at the sub-facility level, which can be a point-source facility or a collection of smaller sources within a contiguous oil or natural gas lease. In many cases, the individual sub-facilities may be exempt from the local air district’s toxic pollutant reporting requirements | Emissions for Oil and Gas facilities are reported as an aggregate of a company's operations in a geologic basin that typically consists of a very large area covering one or more counties |
For more Information, contact pollution_map@arb.ca.gov


