|
|
|
|
|
|
|
2.
|
|
How can I determine how polluted the air is where I live and work? |
TOP |
|
|
|
|
|
|
|
|
|
|
|
|
|
|
|
|
|
|
|
|
You may get a good idea of air quality in your area by clicking on the maps in the answer to Question #4. But if you want more specific information, try the following: |
|
|
|
|
|
|
|
1) |
Select a pollutant (for example, ozone or PM2.5 or PM10); |
|
|
|
|
2) |
Then locate a monitoring site close to your home or work; and |
|
|
|
|
3) |
Then look at key indicators of air quality at this site, such as the "number of days" in a year that the pollutant reaches unhealthy levels. (See Question #5 for a definition of unhealthy air.) |
|
|
|
|
4) |
If you do this first for O3, then for PM2.5, and then for PM10, you will get a good idea of the air quality where you live. |
|
|
|
|
|
|
|
To get started, go to the Top 4 Summary web pages. When you get to the tables that show data, pay special attention to the numbers of Days Above State Standard for O3 and the Estimated Days Above State Standard for PM10. For PM2.5, pay attention to how much the Annual Average exceeds the State PM2.5 standard (which is 12 micrograms per cubic meter). For toxics compounds, there are not many monitoring locations in the State, and unfortunately, probably not one close to your home. See Question #11 on toxics compounds below for more information. |
|
|
|
|
|
|
|
|
|
|
|
|
|
|
|
|
|
|
|
|
3.
|
|
Can't I tell how polluted the air is by looking and by smelling it? And what gives some |
|
|
|
polluted air the brown color? |
TOP |
|
|
|
|
|
|
|
|
|
|
|
|
|
|
|
|
|
|
|
|
 Surprisingly, ozone pollution is invisible and odorless. So air that looks clean may actually have unhealthy concentrations of ozone. Particulate matter can also be at unhealthy levels when the air appears clean. Conversely, some air pollutants can significantly discolor the air and still be at levels that are considered healthy. It is best to check the results of measured air quality, such as the data included on our web site. Surprisingly, ozone pollution is invisible and odorless. So air that looks clean may actually have unhealthy concentrations of ozone. Particulate matter can also be at unhealthy levels when the air appears clean. Conversely, some air pollutants can significantly discolor the air and still be at levels that are considered healthy. It is best to check the results of measured air quality, such as the data included on our web site. |
|
|
|
|
|
|
|
So, what makes the air look really brown? You can blame very small particles in the air. Remember that sunlight is made up of a rainbow of colors all blended together. The small particles keep more of the blue color from reaching your eyes than the remaining colors (this is a result of light scattering). When you take away more of the blue light, the remaining colors of the sunlight give the polluted air a brownish color, sometimes with a yellow or greenish tint. The variation in color largely depends on the particle sizes present. |
|
|
|
|
|
|
|
|
|
|
|
|
|
|
|
|
|
|
|
|
|
|
|
|
|
|
4.
|
|
How does air quality vary statewide? |
TOP |
|
|
|
|
|
|
|
|
|
|
|
|
|
|
|
|
|
|
|
|
Air quality is routinely measured at close to 300 locations in California. These measurements give us a good understanding of the air quality in the various regions of the state. However, specific locations may be affected by specific sources. You can refer to the Report on Assessment of California's Statewide Air Monitoring Network for a discussion of the adequacy of California's air quality monitoring network. |
|
|
|
|
|
|
|
If you want information about the air quality in different parts of the State, try using the Top 4 Summary web pages. You can get summaries of the air quality for an entire region by selecting the Summarize by Air Basin option. (An air basin is a region for air quality purposes; click here to see a map of air basins.) In the resulting table of data, focus on the numbers of # Days Above the Standard for ozone, the Est # Days > 24-Hour Std for PM2.5, and the Estimated # Days > 24-Hour Std for PM10. |
|
|
|
|
|
|
|
You can do something similar to get information for specific sites, just make sure that the Summarize by Site option is selected. Again, pay attention to the number of days above the standards for ozone, PM2.5, and PM10. For PM2.5, also pay attention to how much the Annual Average exceeds the National and State PM2.5 standards (which are 15 micrograms per cubic meter and 12 micrograms per cubic meter, respectively). Question #2 also has information on how to use the Top 4 Summary web pages. |
|
|
|
|
|
|
|
|
|
|
|
|
|
|
|
|
|
|
|
|
5.
|
|
Tell me more about the ambient air quality standards. |
TOP |
|
|
|
|
|
|
|
|
|
|
|
|
|
|
|
|
|
|
|
|
Health scientists determine which air pollutants result in health problems and at what concentration level. This information is the basis of the ambient air quality standards. When concentrations of a pollutant exceed the level of the air quality standard, the air quality is at unhealthy levels. The more frequently the standards are exceeded and the higher the concentrations exceeding the standards, the more unhealthy the air. |
|
|
|
|
|
|
|
In the tables of air quality data on these web pages, you will see that there are data for both the national air quality standards and State air quality standards. California's air quality standards tend to be more stringent than the national standards, i.e., the air is deemed to be unhealthy at lower concentrations. So the State standards tend to be exceeded more frequently. Because of this, the number of Days Above State Standard is a more sensitive indicator of the number of days of unhealthy air. |
|
|
|
|
|
|
|
 To view the State and national air quality standards for ozone and PM, as well as other pollutants, go to our Ambient Air Quality Standards Table. For more information about ambient air quality standards, try www.arb.ca.gov/research/aaqs/caaqs/caaqs.htm. Note that ambient air quality standards are not set for toxics compounds. For toxics compounds, there is generally no threshold concentration below which the air is healthy. For toxics compounds, the greater the quantified health risk, the more unhealthy the air is. To view the State and national air quality standards for ozone and PM, as well as other pollutants, go to our Ambient Air Quality Standards Table. For more information about ambient air quality standards, try www.arb.ca.gov/research/aaqs/caaqs/caaqs.htm. Note that ambient air quality standards are not set for toxics compounds. For toxics compounds, there is generally no threshold concentration below which the air is healthy. For toxics compounds, the greater the quantified health risk, the more unhealthy the air is. |
|
|
|
|
|
|
|
|
|
|
|
|
|
|
|
|
|
7.
|
|
What progress are we making in cleaning up the air? |
TOP |
|
|
|
|
|
|
|
|
|
|
|
|
|
|
|
|
|
|
|
|
The air quality in California has improved dramatically over what it was 20 years ago. Twenty years ago, several air pollutants besides ozone and PM were at harmful levels in California air, including carbon monoxide (CO), sulfur dioxide (SO2), nitrogen dioxide (NO2), and lead. These pollutants no longer exceed health-based standard levels. Also, ozone and PM10 levels used to be much higher than they are currently for most of the State (PM2.5 has been measured for less than 10 years). |
|
|
|
|
|
|
|
 You can look at tables and graphs of air quality trends for ozone and PM10 by going to the Trends Summary web pages. The trends graphs quickly show you the progress for individual sites or entire regions (as air basins). Trends in levels of many toxics compounds have also shown dramatic improvements over the years. For example, check out how dramatically air quality has improved for a couple of the worst toxics compounds, benzene and 1,3-butadiene, by going to the Toxics Summaries web pages. You can look at tables and graphs of air quality trends for ozone and PM10 by going to the Trends Summary web pages. The trends graphs quickly show you the progress for individual sites or entire regions (as air basins). Trends in levels of many toxics compounds have also shown dramatic improvements over the years. For example, check out how dramatically air quality has improved for a couple of the worst toxics compounds, benzene and 1,3-butadiene, by going to the Toxics Summaries web pages. |
|
|
|
|
|
|
|
|
|
|
|
|
|
|
|
|
|
9.
|
|
I'm surprised that, in some cases, the worst ozone air quality is not occurring where most |
|
|
|
of the people and pollution sources are. Why is this? |
TOP |
|
|
|
|
|
|
|
|
|
|
|
|
|
|
|
|
|
|
|
|
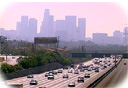
You are right about this. For example, in the Sacramento area, the worst ozone air quality tends to take place about 15 miles or more east of the urban core. In the greater Los Angeles area, the worst ozone air quality often is in the mountains to the northeast. In Fresno and Bakersfield, it is 10 to 15 miles to the southeast. Why is this? Ozone is not directly emitted as a pollutant. Other pollutants are emitted, e.g., from cars and trucks, and undergo chemical transformation in the atmosphere to form ozone. In the time it takes the ozone to form, the light winds typical of high ozone days have transported the polluted air about 10 to 20 miles downwind. Because ozone is invisible and odorless, people living in such outlying areas may not realize their air quality is worse than in the urban core. |
|
|
|
|
|
|
|
|
|
|
|
|
|
|
|
|
|
11.
|
|
Tell me more about toxics compounds. |
TOP |
|
|
|
|
|
|
|
|
|
|
|
|
|
|
|
|
|
|
|
|
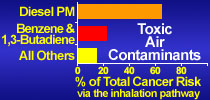
The toxics compounds are compounds like diesel particulate matter, benzene, 1,3-butadiene, and hexavalent chromium. These have been found or are suspected of having chronic, negative health effects such as cancer. A large portion of the known health risk posed by these compounds results from emissions from motor vehicles, including cars and trucks and a host of other "mobile sources" that don't necessarily travel on roads. Estimates are that more than 60% of the identified chronic health risks associated with air toxics result from diesel particulate matter. Our air quality information for diesel particulate matter is based on emissions estimates, while our information for other toxics compounds is based on ambient monitoring. We monitor at 17 urban monitors, representing one of the most extensive state toxics monitor programs in the nation. Since 1990, the cancer risk from toxic air pollutants has fallen by 75% statewide, despite significant industrial growth and a substantial increase in the number of motor vehicles. |
|
|
|
|
|
|
|
 You can view summaries and trends of the toxics air quality data by checking out the Toxics Summaries web pages. For starters, you may want to focus on data for benzene and 1,3-butadiene, which result in significant health risks in parts of California. In the tables, pay attention to the far right hand column of Estimated Risks. You can view summaries and trends of the toxics air quality data by checking out the Toxics Summaries web pages. For starters, you may want to focus on data for benzene and 1,3-butadiene, which result in significant health risks in parts of California. In the tables, pay attention to the far right hand column of Estimated Risks. |
|
|
|
|
|
|
|
For more information, go to the ARB's Almanac, Chapter 5 and to www.arb.ca.gov/toxics/toxics.htm. For a fact sheet specific to diesel particulate matter, go to www.arb.ca.gov/diesel/factsheets/rrpfactsheet.pdf. |
|
|
|
|
|
|
|
|
|
|
|
|
|
|
|
|
|
|
|
14.
|
|
Where can I find more information about air pollution? |
TOP |
|
|
|
|
|
|
|
|
|
|
|
|
|
|
|
|
|
|
|
Try these links for more information about air pollutants, health effects, sources of pollution, actions you can take to improve air quality, and more. Some of this information is great for students and teachers. |
|
|
|
|
 |
www.arb.ca.gov/ch/educational/understanding_air_pollution.htm |
|
|
|
|
|
www.arb.ca.gov/knowzone/knowzone.htm (great for kids, students, and teachers) |
|
|
|
|
|
www.airnow.gov/index.cfm?action=aqikids_home.index (more for kids, students, and teachers) |
|
|
|
|
|
www.smogcity.com/home.html (more for kids, students, and teachers) |
|
|
|
|
|
50 Things You Can Do for Cleaner Air |
|
|
|
|
|
www.sparetheair.com/index.cfm?page=take_action (actions you can take) |
|
|
|
|
|
www.arb.ca.gov/html/fslist.htm (ARB fact sheets and brochures) |
|
|
|
|
|
|
|
|
|
|
|

 and worst through the summer to the end of the year and on into January. Throughout much of the State, for example, ozone is worst from June through September. And PM2.5 and PM10 are worst from October through January. In parts of the greater Los Angeles area, however, the season of high ozone levels typically starts in April and extends through October, the season of high PM10 levels starts in May or June and extends through October, and PM2.5 can reach high levels throughout the year. Of the toxics compounds that we measure that pose the greatest chronic health risk, the worst ambient air quality appears to be from October through February. This is because weather conditions that time of year often restrict the dispersion of the toxics compounds, causing ambient concentrations to increase.
 We need more ozone high up in the atmosphere
 and less ozone where we live, work, and play. And the two don't intermingle in any relevant way. What is good at 200,000 feet above us is not good in the air we breathe. If you are interested in more information about climate change, go to www.arb.ca.gov/cc/cc.htm, or epa.gov/climatechange, or epa.gov/climatechange/kids.
 I'm glad you asked. A lot is being done at State, federal, and local levels of government. But that is a discussion for another web page. Try the following web pages:
 This approach is also used in forecasting what the air quality will be tomorrow or later the same day. It can be useful in informing you when it is best to avoid polluting activities such as driving or outdoor activities such as running or gardening. The information is based on measured air quality for a number of pollutants. This system is called the Air Quality Index or AQI. To learn more, go to www.arb.ca.gov/aqmis2/MainPgLinks/aqi.php and www.airnow.gov.